About uhslcAdmin

This author has not yet filled in any details.
So far uhslcAdmin has created 6 blog entries.

Multi-model ensemble sea level forecasts for tropical Pacific islands

Sea level anomaly extremes impact tropical Pacific islands, often with too little warning to mitigate risks. By compiling monthly sea level anomaly predictions from multiple statistical and dynamical (coupled ocean-atmosphere) models, which are typically skillful out to at least 6 months in the tropical Pacific, improved future outlooks are achieved. We deliver an experimental real-time forecast of monthly mean sea level anomalies and information that can be used to reduce impacts associated with sea level extremes. Figure. Hourly sea levels (cm) for Guam during October 2015. Tide predictions (blue) are based on harmonic analysis of the Apra Harbor sea level recorded during the National Tidal Datum Epoch (NTDE; 1983–2001) with the long-term trend removed. The total sea level prediction (orange) combines the expected tides with our multi-model mean sea level anomaly prediction (green) and the long-term trend (5 cm). For reference, the highest and lowest 5% of astronomical tides during NTDE are shown (dashed). Sea levels are with respect to the Mean Lower Low Water (MLLW) datum. Widlansky, M., J. Marra, M. Chowdhury, S. Stephens, E. Miles, N. Fauchereau, C. Spillman, G. Smith, G. Beard, and J. Wells (Early Online Release), Multi-model ensemble sea level forecasts for tropical Pacific islands. [...]

2017-08-30T17:36:42-10:00January 20th, 2017|Research|

Indian Ocean sea level on the rise

From University of Hawaiʻi News – A new paper in the Journal of Geophysical Research shows that sea level rise in the northern Indian Ocean rose twice as fast as the global average since 2003. This represents a stark contrast to the previous decade when the region experienced very little sea level rise at all. The science team led by Philip Thompson, associate director of the University of Hawaiʻi Sea Level Center in the School of Ocean and Earth Science and Technology (SOEST), analyzed two and a half decades of ocean surface height measurements taken from satellites. The satellite data showed a substantial and abrupt increase in decade-long sea level trends in the Indian Ocean region, which prompted the oceanographers to investigate the cause of the shift using computer simulations of ocean circulation. “Wind blowing over the ocean caused changes in the movement of heat across the equator in the Indian Ocean,” said Thompson. “This lead to suppression of sea level rise during the 1990s and early 2000s, but now we are seeing the winds amplify sea level rise by increasing the amount of ocean heat brought into the region.” Reversal of winds When trade winds in the Indian Ocean [...]

2017-08-30T17:36:42-10:00September 13th, 2016|Research|

Considerations for estimating the 20th century trend in global mean sea level

Recent efforts in reconstructing historical sea level change have led to a range of published estimates for the global mean sea level trend over the last century. Disagreement in these estimates can be attributed to two factors: (1) differences in analysis and/or reconstruction techniques and (2) differences in tide gauge selection and quality control of the data. Here the impact of tide gauge selection is explored by calculating global mean trends using three different tide gauge data sets that have been utilized in recent reconstruction studies. The inclusion of tide gauge records that are affected by unresolved internal variability and/or unaccounted for vertical land motion are found to significantly impact the estimates of the long-term trend in global mean sea level. In conclusion, several guidelines are presented regarding the selection of tide gauges for use in historical reconstructions focused on estimating the 20th century global mean sea level trend. Figure. Twenty-year trends in global mean sea level (mm/yr) from 1900 to 2013 estimated by simple averaging of tide gauge data sets from Ray and Douglas (2011) (blue), Church and White (2011) (red), and Hay et al. (2015) (black). (a) The trends using all of the available gauges. (b) The trends [...]

2016-03-23T14:12:29-10:00May 28th, 2015|Research|

A unique asymmetry in the pattern of recent sea level change

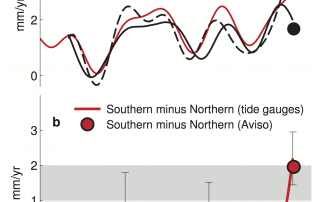
The spatial pattern of 20 year sea surface height trends from satellite altimetry is placed into the context of historical modes of wind-driven ocean volume redistribution identified in basin-scale, regional averages of tide gauge data. The difference between recent rates of sea level change in northern and southern regions is found to be twice as large and statistically greater than any other 20 year period during the twentieth century. This unique asymmetry in the pattern of sea level change coincides with a departure from a historical mode of volume redistribution between southern regions related to a measure of asymmetry in the Southern Annular Mode. The asymmetry also coincides with a maximum in the rate of global mean sea level rise during recent decades, but the asymmetry is not apparent during an early twentieth century maximum in the global rate of similar magnitude. Figure. (a) Twenty year rates of change in mean sea level over northern and southern regions from tide gauges, Aviso, and Church and White [2011]. (b) The difference between mean rates over northern and southern regions from tide gauges and satellites. Uncertainties (1σ) are shown for the three largest differences in rate from tide gauges. Thompson, P. R., and M. A. [...]

2016-10-05T16:32:12-10:00November 12th, 2014|Research|

Observations and estimates of wave-driven water level extremes at the Marshall Islands

Wave-driven extreme water levels are examined for coastlines protected by fringing reefs using field observations obtained in the Republic of the Marshall Islands. The 2% exceedence water level near the shoreline due to waves is estimated empirically for the study sites from breaking wave height at the outer reef and by combining separate contributions from setup, sea and swell, and infragravity waves, which are estimated based on breaking wave height and water level over the reef flat. Although each component exhibits a tidal dependence, they sum to yield a 2% exceedence level that does not. A hindcast based on the breaking wave height parameterization is used to assess factors leading to flooding at Roi-Namur caused by an energetic swell event during December 2008. Extreme water levels similar to December 2008 are projected to increase significantly with rising sea level as more wave and tide events combine to exceed inundation threshold levels. Figure. (a) Reconstruction of the December 2008 flooding event at Roi-Namur based on tide + sea level from the Kwajalein tide gauge, breaking wave height (Hb) estimated by shoaling deep water wave heights from the WaveWatch III hindcast (8), and estimated 2% exceedence water level (𝜂̃2) based on (2). Inundation is [...]

2016-03-22T22:54:46-10:00October 20th, 2014|Research|

Wind-Driven Coastal Sea Level Variability in the Northeast Pacific

The rate of coastal sea level change in the northeast Pacific (NEP) has decreased in recent decades. The relative contributions to the decreased rate from remote equatorial wind stress, local longshore wind stress, and local windstress curl are examined. Regressions of sea level onto wind stress time series and comparisons be- tween NEP and Fremantle sea levels suggest that the decreased rate in the NEP is primarily due to oceanic adjustment to strengthened trade winds along the equatorial and coastal waveguides. When taking care to account for correlations between the various wind stress time series, the roles of longshore wind stress and local windstress curl are found to be of minor importance in comparison to equatorial forcing. The predictability of decadal sea level change rates along the NEP coastline is therefore largely determined by tropical variability. In addition, the importance of accounting for regional, wind-driven sea level variations when attempting to cal- culate accelerations in the long-term rate of sea level rise is demonstrated. Figure. (right) Location of tide stations for (left),(middle) panels. (left) The fraction of sea level variance accounted for by the equatorial (yellow), longshore (blue), WSC (gray), and combined (red) components in a multiple regression. (middle) Linear rates of [...]

2017-08-30T17:36:42-10:00June 5th, 2014|Research|
Go to Top